Root Cause Analysis & Related Events
Related Events
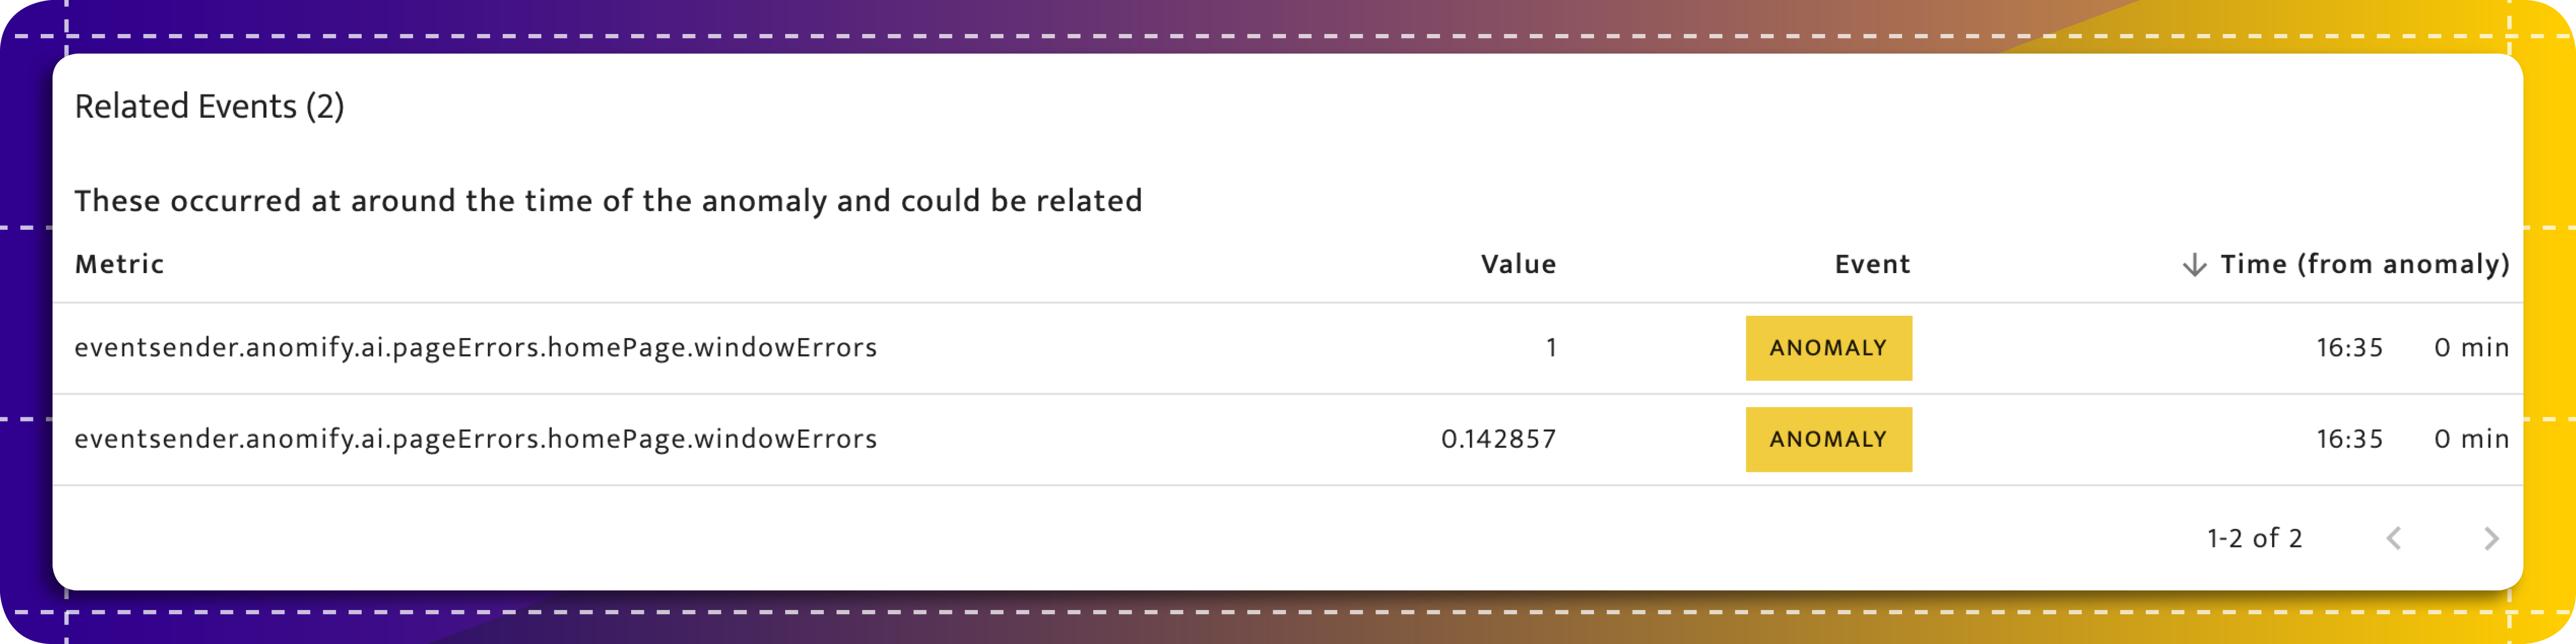
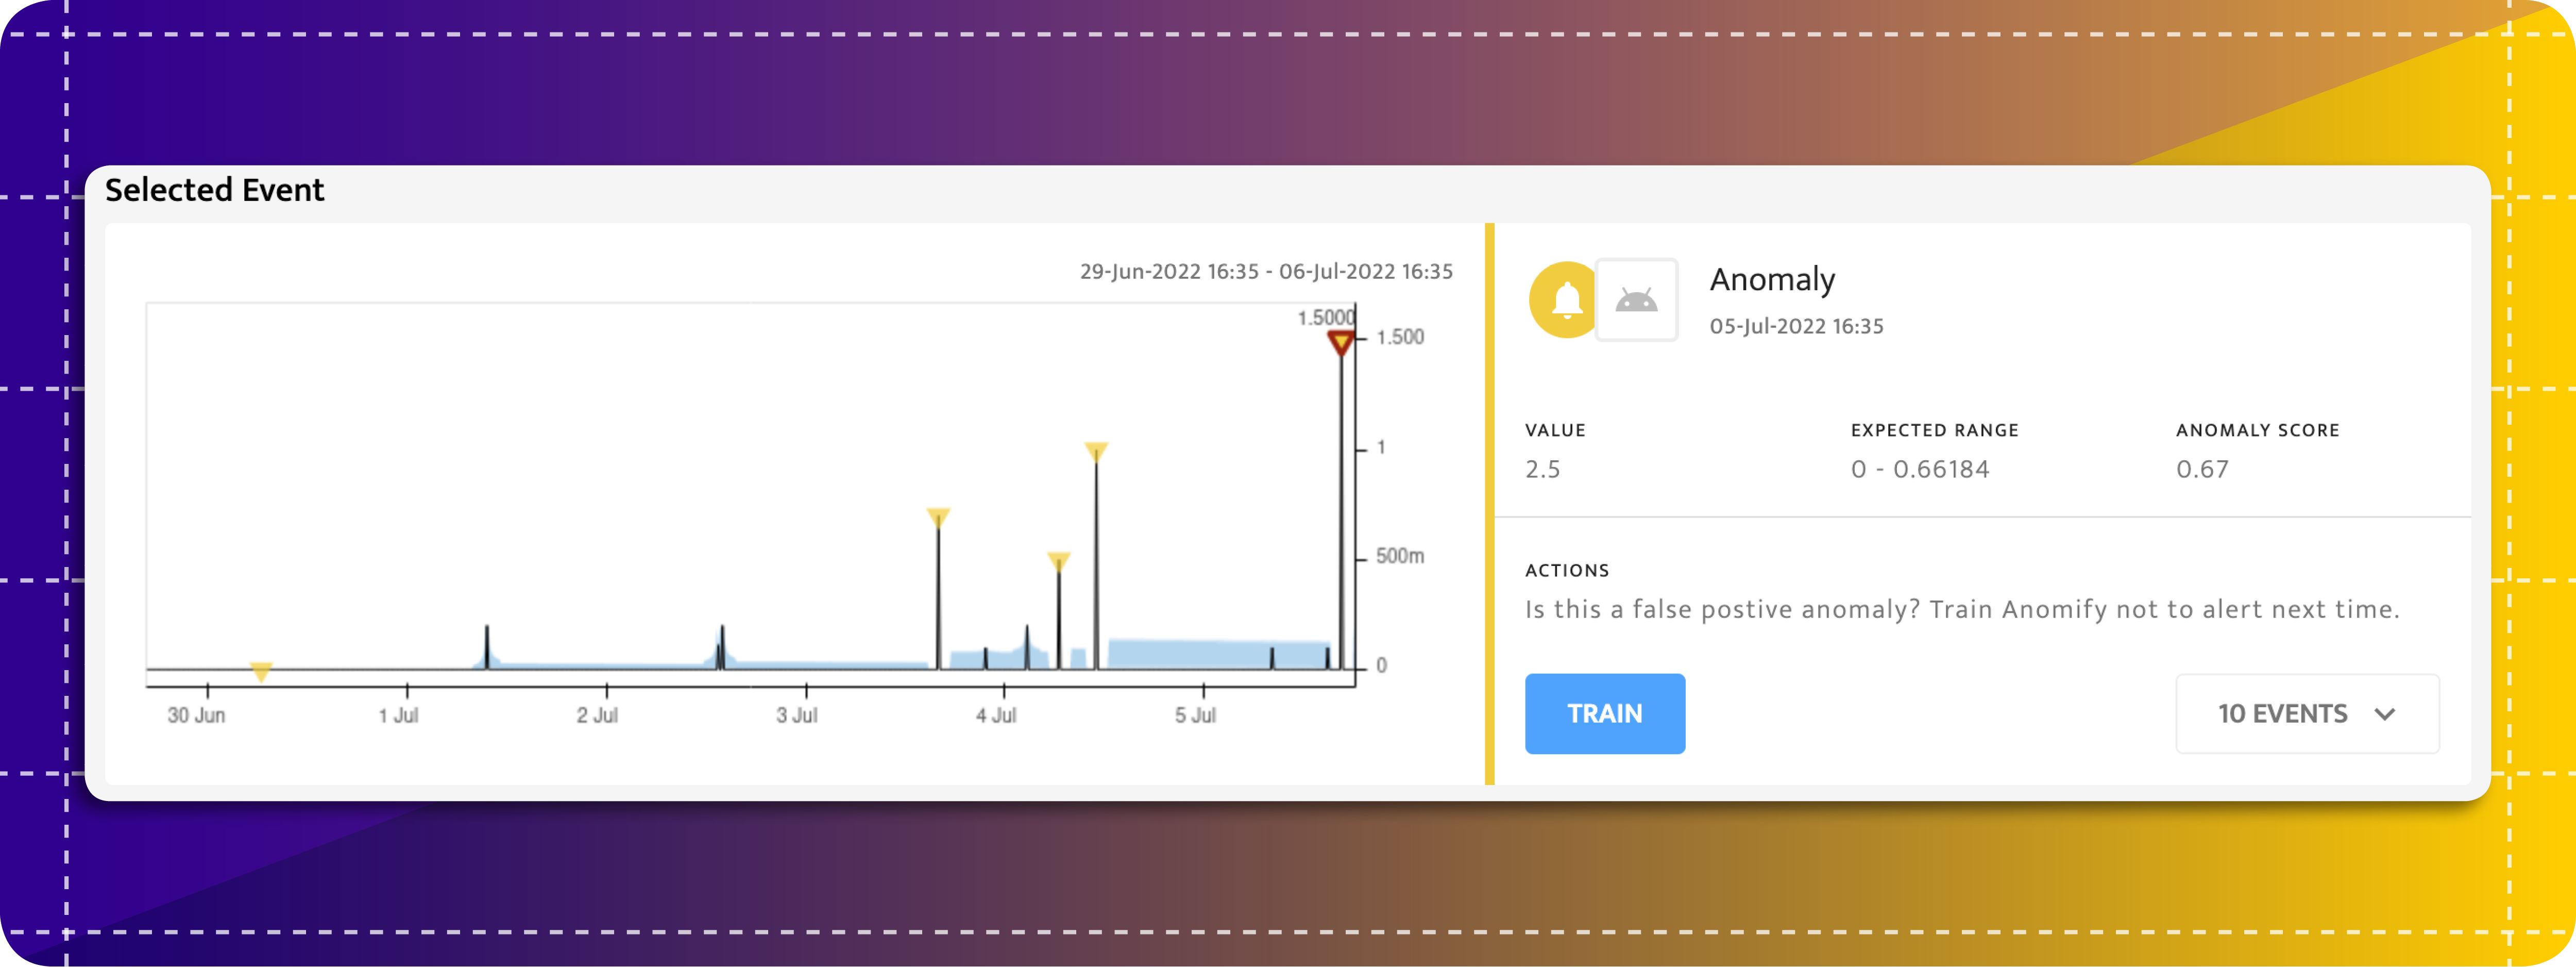
Selecting an anomaly in a metric graph loads details of the event in a box below the graph. There you will find a table listing other events that occurred within two minutes of the event selected in the graph above. Events that occurred across your entire metric population are considered by default. You can define smaller correlation groups which will limit the results in the table. Get in touch with the team to set these up.
Root Cause Analysis
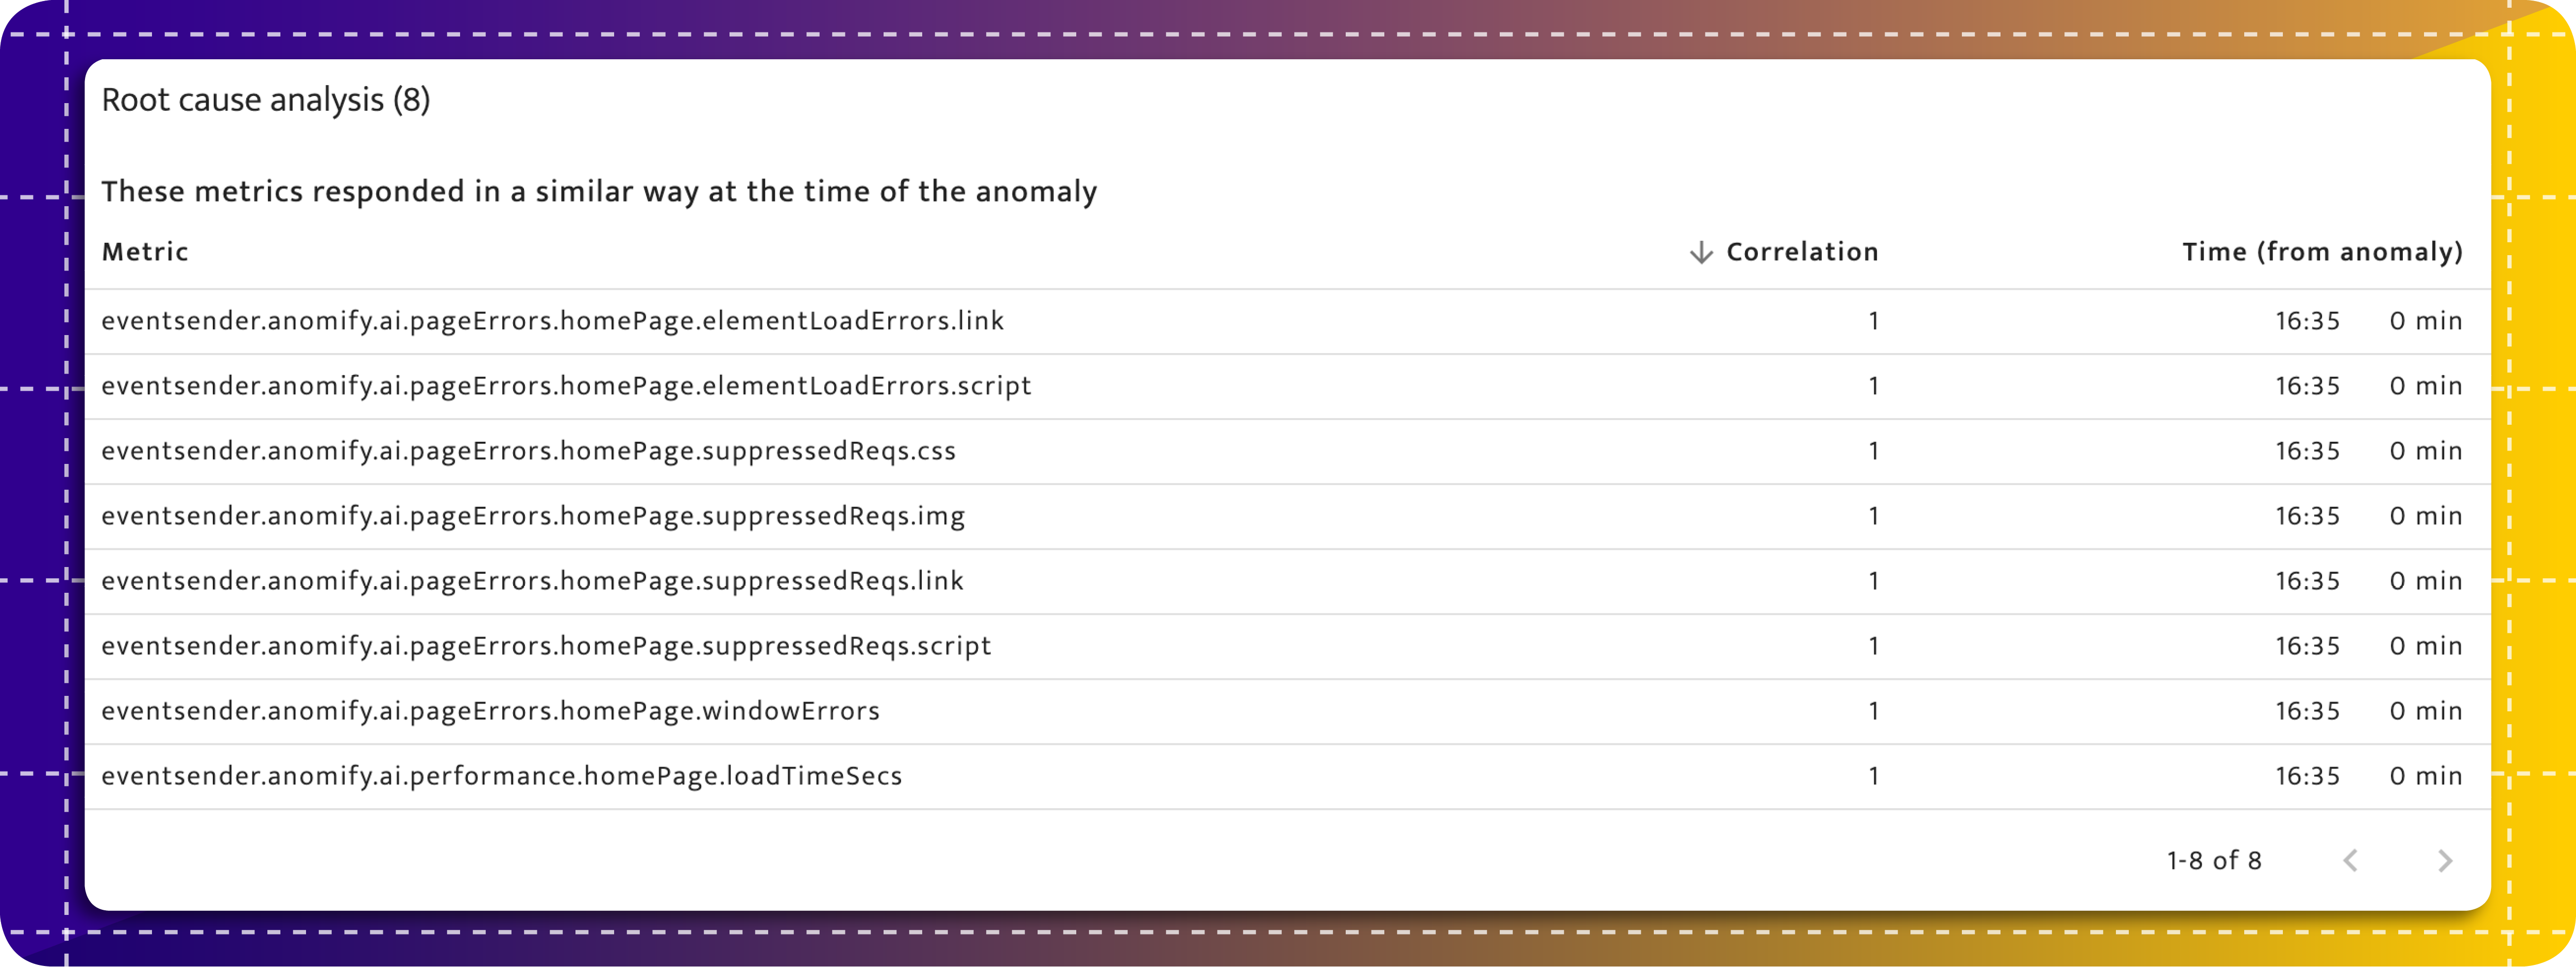
Below the Related Events is a table listing metrics which correlated with the selected event at the time it occurred. Highly correlated events can be related. The first in a set of correlated events could point you towards the root cause of the issue. Like Related Events, the entire metric population is correlated by default. You may wish to create correlation groups for ease of analysis, if you wish to do this please get in touch.