Alert Structure
When you receive an alert it will look something like this:
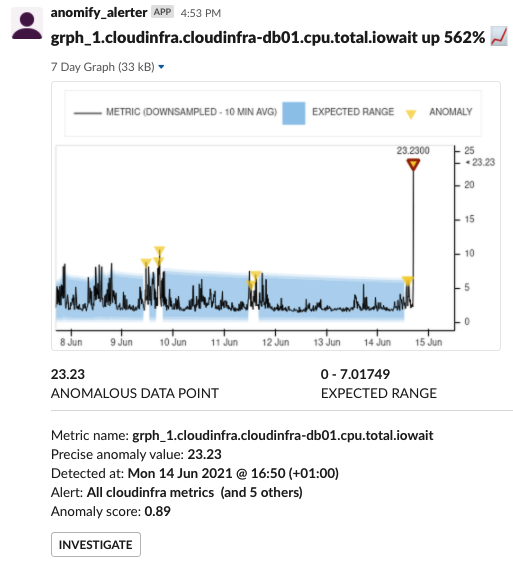
Metric name: The name of the metric.
Precise anomaly value: The value of the anomaly recorded at the time it was detected. You may see a slightly different value in the alert graph due to aggregation of the graph data.
Detected at: The date and time at which the anomaly was detected.
Alert: The title of the alert that was triggered by this anomaly. If multiple alerts are watching this metric then the additional alerts are counted in brackets (e.g. "5 others").
Investigate button: view the affected metric in more detail in the dashboard where you can:
- assess whether the anomaly is still occurring.
- find related events and carry out root cause analysis at the bottom of the page.
- train the Anomify not to alert on this sort of data in the future.